Last Updated on November 23, 2024 by Owen McGab Enaohwo
As a business owner or executive, you will always want to find ways to deliver better value to your patrons. Even so, for the most part, we tend to improve only when the need is staring us in the face. Either a business will go with a putting-out-fires approach or implement disconnected initiatives from time to time.
No one can be blamed, though—change is hard, after all. But what if there was a well-thought-out, scientific method to implementing organization-wide change?
Value stream mapping (VSM) is one of the most tried and tested approaches to helping an organization understand where it currently stands, where it can be, and in how much time. VSM is particularly important when we consider the shifty nature of modern work. New tools and technologies are being developed every day, which can have a dramatic impact on how we work.
Unfortunately, finding inefficiencies is easier said than done. It’s hard for a number of reasons. A company may be set in its ways. The inefficiencies might lie in its workforce rather than process design. And of course, let’s not forget that people naturally resist change.
Whatever the reasons may be, finding and eliminating inefficiency is key to success today. And value stream mapping does just that. VSM attempts to visualize all the processes you use to create and deliver goods to your customers.
Through VSM, you can stay on top of your value chain’s performance and identify both bottlenecks and opportunities for improvement. Let’s see what VSM is and how you can add it to your organization’s skill sets.
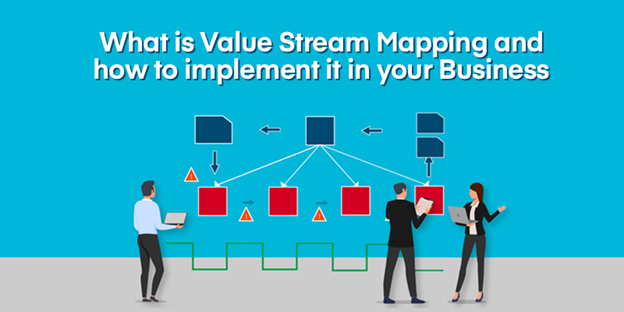
What is Value Stream Mapping?
A value stream consists of all the processes existing in your business. Value stream mapping, aka value stream analysis, then uses flowcharts to identify waste, reduce process time, and increase efficiency.
The method is part of lean methodology, which attempts to constantly identify and remove non-value-adding steps from a business process.
VSM first defines the current state of the business as per its existing processes. It then defines the future state at which the business aims to be.
The object of a VSM exercise is to move from the current state to a desired future one. It does so via value stream diagrams that give a quick snapshot of all the processes used in a company. It then creates a potential map toward the future state.
VSM applications can vary greatly from company to company as each may have its own priorities. But generally speaking, there are seven types of commonly accepted wastes that VSM diagrams are used to eliminate. These are straight from Toyota’s handbook—the Toyota Way, aka the Toyota Production System.
- Faster than necessary pace: This is known as overproduction which can result in storage and lead-time issues.
- Waiting: Any time goods are not delivered to their intended destination.
- Excessive conveyance: Conveyance is the process through which goods are moved from one place to another. Ideally, a company will want the goods to be moved in as few steps as possible.
- Processing wastes: Using overly complex procedures when simpler ones are available.
- Excess stock: Keeping more inventory than needed can result in wasteful storage costs and poor lead times.
- Unnecessary motion: Movements by men and machines that are not really needed.
- Correction of mistakes: Costs related to correcting defects. The more the defects, the higher the cost.
Additionally, Yasuhiro Monden, who was instrumental in founding the Toyota Production System, identified three types of operations that VSM can address:
- Non-value-adding operations: Wasteful processes that don’t add any value to the organization.
- Necessary by non-value-adding operations: Processes that don’t add value but are required, nevertheless. Typically, a VSM’s future state will attempt to remove such operations.
- Value-adding operations: All operations that contribute to an organization’s output.
VSM is by no means a new invention. Its story is an interesting one and can be traced back to the early 20th century.
A Quick History of VSM
While process efficiency has been a core business interest for as long as we can remember, VSM as a method started out in 1918 with Knoeppel’s installing efficiency methods. In his seminal work, Knoeppel proposed the usage of flowcharts and diagrams to better visualize business processes.
VSM didn’t gain mainstream recognition until the 1950s, when Toyota came out with the Toyota Production System (TPS). The system used two methods: jidoka, which roughly translates to automation with a human overview, and just in time (JIT), which produces output as and when required. Although Toyota called their method material and information flow mapping.
Over the years, the phrase “lean manufacturing” became ubiquitous in business circles. By the 1990s, VSM had become a commonly accepted term for material flow diagramming and was in use by many companies the world over.
How to Know if You Need VSM
Most companies, especially SaaS, start something like this: They offer a basic product that targets multiple needs. They then see which features are a hit with which customer persona, then focus on them exclusively.
While this process can be called tried and tested, it also presents challenges. For one, companies are always on the lookout for gaps in their competitor’s products. These missing features can then be offered as competing offerings.
A great example of this is how Facebook managed to beat Myspace even though it came to the social scene later. By 2010, Facebook’s popularity had caused its rivals to go after niche markets. While Myspace and other platforms like Orkut only focused on specific-use cases, Facebook offered whatever features its customers wanted. From games to stories to sharing more personal details, Facebook had it all.
Startups and established companies alike want to be able to identify such gaps if they want to survive in today’s hypercompetitive markets. And VSM helps them do just that.
VSM comes with all the tools needed to identify such gaps. Furthermore, it can also help companies stay competitive by giving them a bird’s eye view of how value flows through their organization.
Even so, it’s hard to identify if there’s any need for further improvement. After all, a VSM initiative will take valuable time and resources. So, look out for the following signs of process bloating in your organization:
You have way too much paperwork:
If your office has a mounting pile of paperwork in every corner, then you may be paying for needless processes.
Your people are working overtime, a lot:
All companies have days where people work overtime. But it’s an entirely different thing if working past the agreed hour is the norm. Overworked employees eventually become unproductive, which affects output and drives up costs. If your staff appear tired, demoralized, or lethargic, then you may need to review your value stream for bottlenecks.
Your CMS is a mess:
Many companies today still rely on spreadsheets and emails to manage their content. If your staff is spending too much time trying to find different versions of documents attached in emails, or they’re scouring three different CMS systems to find what they are looking for, then VSM can help you simplify things.
Your sales response times are too slow:
It takes a lot of time and money to generate high-quality leads. And if your sales team takes forever to follow up on them, then you’re shelling a lot of money down the drain. Your MQLs should at least result in industry-standard conversions.
Your employees need way too many approvals:
Horizontal hierarchies and worker empowerment are all the rage today. But these ideals don’t mean much if employees still need constant approval from their supervisors or if they spend most of their time filing reports.
How to Use VSM to Reduce Waste
We’ve already touched on the different types of wastes VSM deals with. Let’s take a closer look at each one of them.
Reduce overproduction:
Having sufficient inventory to both tackle demand and have enough reserves makes sense. However, creating more products than demand is wasteful as excess items just sit as unused inventory. So, companies need to keep just the right amount of product on hand to meet the demand. But as demand itself is highly fluid, so must be your production.
Overproduction can take many shapes. More parts may be created before they are ready for the next stage. Or more items are created than market demand.
Overproduction can not only lead to wasted resources, but it can cause waiting, motion, and inventory wastes as well. More often than not, companies overproduce due to a poor understanding of market requirements.
The best way here is to work your way backward from the customer. Understanding demand peaks and troughs can help you plan your production.
Optimize inventory:
Overproduction leads to excess inventory, which needs space and looking after, both costs a company can do without. You can use takt time to determine your inventory flow rate. Takt time is defined as available time divided by customer demand. So, if you get one order every two hours, then your team needs to produce at least one product in two hours or less.
Get rid of motion waste:
Moving around costs both time and energy, both for employees and machines. There is no formula for calculating motion waste. Ideally, each process should be completed in as few steps as possible.
To reduce motion waste, your workplace needs to be organized such that people and equipment needn’t go farther than they absolutely need to. Motion waste applies to e-commerce as well. Excessive clicks, data entering, and form filling all qualify as wasted movements that should be eliminated.
Eliminate defects:
Product defects need resources to fix. They carry recycling, shipping, and man-hour costs. But it’s important to identify why defects are occurring. Since VSM can help you visualize your entire value chain, it makes it easy to see where the defects are occurring.
Reduce inventory waiting time:
There’s always a waiting period between phases in any manufacturing process. Inventory may lie idly as products are being assembled. Employees may wait as parts are being delivered to them. Or products may sit in the warehouse waiting to be delivered to the market. Waiting inventory eats up storage space and cost, so it needs to move as fast as possible.
VSM can help you here by identifying gaps in your processes which may be resulting in long wait times. Mapping processes involve recording the average time spent on each stage. If certain processes are taking longer than usual, then they can be redesigned to shorten the waiting time.
Stop overprocessing:
Companies can overprocess a product or service by adding features that aren’t really necessary. For example, beautifying a part of the product that’s not visible is not really required and is therefore overprocessing. Likewise, bloating up a SaaS product or service with features that were never requested is unnecessary. Companies can also unknowingly commit over processing by having too much paperwork for each step of their value process.
Since overprocessing can take many shapes, it’s best to use VSM techniques to eliminate steps that don’t directly address a customer’s pain points.
Stop over-transporting:
Like motion waste, which is generally restricted to company premises, your vehicles too can waste resources, making more rounds than necessary. Ideally, you will want all facilities involved in creating, storing, and transporting your products to the market as close as possible. However, since this isn’t realistic, you can use VSM to find the best layout for your business’s layout. It’s best to treat your entire operation as a potential problem in need of a solution here.
Symbols Used in VSM
VSM, being a flowchart system, uses many symbols for each action. Here’s a quick description of some of the most commonly used symbols in VSM.
VSM Process Symbols
 | Customer/Supplier | The symbol represents the supplier if placed in the upper left corner of a supply diagram. It means the customer is placed on the right of the value diagram. |
 | Process flow | Can represent a department, operation, or machine with a fixed material flow. |
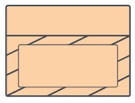 | Shared process | Unlike the process flow diagram, this symbol indicates processes that are being used by more than one value stream. |
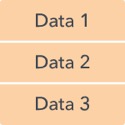 | Data box | These boxes are used for information about other processes, either for record-keeping or analysis. |
 | Inventory | Symbol to represent inventory which is either being moved between two processes or stored for later use. |
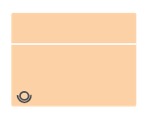
 | Shipment | This symbol denotes supplies coming in or products going out. |
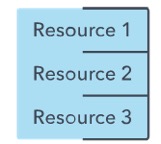 | Resource box | This symbol denotes a stock point for downstream customers. |
 | External shipment | Represents external shipments from suppliers or to customers. |
 | Production control | Symbolizes production control scheduling department. |
 | Information flow | Denotes manual flow of information through paper or conversation. |
| Electronic information flow | Denotes digital information flow through electronic means. | |
 | Production | Indicates production needed to supply parts downstream. |
 | Kaizen burst | Highlights problem areas and/or improvement opportunities. |
Refer to this list for a full list of VSM symbols and definitions.
Challenges to Implementing VSM
Change is never easy. Period. Not only can you expect resistance from your employees, but the change itself has to be worth the amount of effort it will take to pull it off. Here are some of the challenges you can expect and how to mitigate them:
Your employees refuse to cooperate
As part of your value stream analysis, you can find that certain jobs/positions need to be eliminated and new ones added. Several previously important roles may become less relevant, while some employees may gain status privileges over others. All of this is bound to result in friction and a general refusal to cooperate.
Solution: The changes suggested have to make sense for the person on the ground. If they have questions that make sense but aren’t answered, they will resist the instructions. This possibility can be countered by involving the people who will be affected by the change in the planning process. If the people see the inherent benefit which can be gained by transitioning to the new state, they won’t resist it.
Your organization is too large and complex to map out accurately
If you run a multi-national company or one with several hundred outlets, then mapping them all out may seem like a daunting task. Many regional centers and offices may have their own style of working and will need to adhere to local laws, making streamlining everything a task.
Solution: Go slow. You don’t have to redo your entire organization in one fell swoop. Chances are you will note inefficiencies in certain departments or offices, while others will be doing fine or even excelling. Focus on creating specific value stream maps and future states for the low-performing departments only. Try to get the top performers to share what they’re doing right to speed things up.
4 Tools You Can Use for Value Stream Mapping
VSM techniques and tools have aged well, and today we have cloud-based applications that can help you identify and eliminate waste in your organization.
Smartdraw
Features: Interface is familiar to MS Office, syncs with Google, good CAD capabilities.
Price: $5.95/user/month for multiple users. $9.95 user/month for single users. $297 per download for Windows version.
Free trial: 7 days
One of the oldest mapping solutions, Smartdraw today has a plethora of capabilities ideal for VSM. There are many diagramming software options out there that can be used for VSM. But what sets Smartdraw apart from the pack is that it comes ready with all VSM you could ask for. The feature already comes with all the symbols needed in VSM. You can start creating your value stream maps without needing to draw custom symbols or importing them in.
Furthermore, Smartdraw comes with specific VSM templates you can use to create your own processes. You can simply choose the value stream map most similar to the one your organization needs and then start implementing it.
Smartdraw offers two versions: a downloadable Windows version and a web-based version. Both have a trial period of seven days. The interface is quite similar to MS Word, so it should feel instantly familiar to MS Office users. The web-based version has a few additional features, including the ability to integrate with Google Drive products.
Both the versions are also priced differently. While the Windows version has a flat price of $297, the online version pricing starts at $9.95 per month for single users and $5.95 per month for multiple users. You will be charged for the whole year when you checkout.
The tool is ideal for companies looking for basic VSM features. If all you’d like to do is draw your value diagrams and share them with your team, then Smartdaw is the best tool for you.
Creately
Features: Emphasis on collaboration, available for all platforms, live training
Price: $4.95/user/month for single users. $6 user/month for team users. Custom pricing for enterprise users.
Free trial: Offers a free version with limited features.
What sets Creately apart from the competition is just how simple and intuitive it is to use. The interface is minimalist and easy to navigate. All you have when you log in is the symbols and whitespace to do what you want with them. Simply select your project type, and you will be presented with all the required symbols on the right side. Drag them to the project space and do what you want with them.
Creately also has one of the largest selections of templates for each project type, including VSM. In fact, it’s clear that Creately has considered VSM thoroughly. They offer VSM templates for virtually every VSM step, including current state, future state, and typical value stream mapping.
Unlike Smartdraw, which has a time-based trial period, Creately offers a free version with a few features locked. The free version has one folder, a limited shapes and symbol library, and a basic collaboration ability that lets you work with others so long as you’re online. The Team version, on the other hand, allows ten people to collaborate without restrictions.
Plutora
Features: VSM suite specifically for software development, advanced analytics
Price: Available on request.
Free trial: Yes
Unlike Creately and Smartdraw, which can be used for any application, Plutora is focused solely on enterprise-level IT development and release management.
Enterprise IT solution providers usually have a disparate array of tools and methods to track their work. Usual productivity tracking methods involve spreadsheets, checklists, and schedules. While they have been used effectively, they also suffer from serious drawbacks.
It’s hard to keep track of multiple spreadsheets and documents. Managers can easily overlook important opportunities or mistakes when they have to refer to 10 spreadsheets for a single project. Teams also won’t be able to create a picture of their value stream if they depend solely on a collection of documents being passed between the members.
Plutora lets IT companies track their value stream from start to finish, all under one heading. Managers can move all their data and spreadsheets to Plutora, which can act as a single source of truth to derive all information.
Plutora comes with the usual value stream mapping symbology, methods, and templates that can be implemented at the get-go. But what truly sets it apart is its ability to implement the entire process.
You can assign and track each task within Plutora, which gives you a bird’s eye view of the entire value chain. Since the projects will be worked on within the value map, it becomes easier to identify opportunities for improvement.
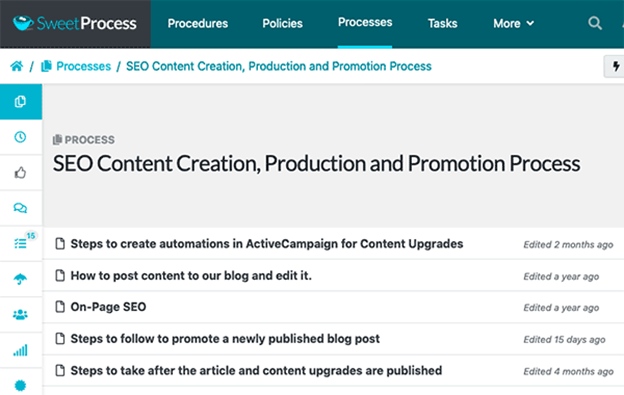
SweetProcess
Features: Document processes, procedures, and policies, steps can be added to each as checklists and can include videos and/or pictures, enables training on the job
Price: $99/month for up to 20 members plus $5/month for every additional user
Free trial: 14 days; no credit card required
While SweetProcess isn’t a dedicated VSM suite, it offers features critical to any value mapping efforts. Businesses are essentially a string of processes. Even a value stream map gives a visual representation of each of your business’s various processes.
But VSM methods have a flaw as well. Their emphasis on visualization usually means it’s hard to document process details, particularly for elaborate ones. The small boxes and burst symbols used in VSM can only capture so much information. Certain processes may require more detailed documentation.
SweetProcess can help your VSM efforts in two ways. Firstly, the cloud-based tool comes with the ability to document business processes, procedures, and policies, right down to the last detail.
SweetProcess doesn’t just make it easy to document your processes. Each process can be turned into a trackable checklist and issued to a team or team member. Comments can also be made on each process.
Secondly, SweetProcess can also help you to track each process from start to finish. This enables real-time oversight of your business processes. Team members have to check each task they complete. They can also leave questions or notes on a process card if they wish, highlighting opportunities for improvement.
How to Implement VSM in Your Organization
Even though VSM has developed considerably over the years, how it’s implemented in an organization still depends on the latter’s requirements. No two organizations are the same. Consequently, they will have different challenges and opportunities, vis-a-vis improvement.
That being said, all VSM efforts share a common foundation they build off of. Here’s how to create your first value stream map.
Step 1: Identify your VSM scope
Since all products and services exist to satisfy consumer requirements, it’s prudent to begin with the latter. You can use buyer persona(s) to draw out your value streams better. Each persona and the product lines that cater to it can be a value stream in itself.
Consider tasking each team with mapping its own product line. So, if you have four product lines, then you should also have four value stream maps, each with its own production, lead time, and sales volume.
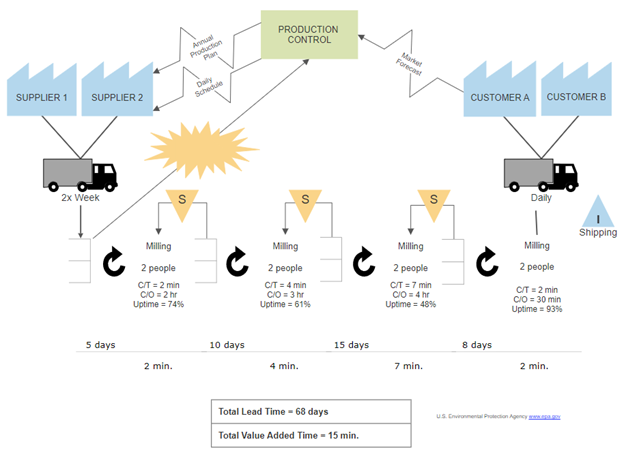
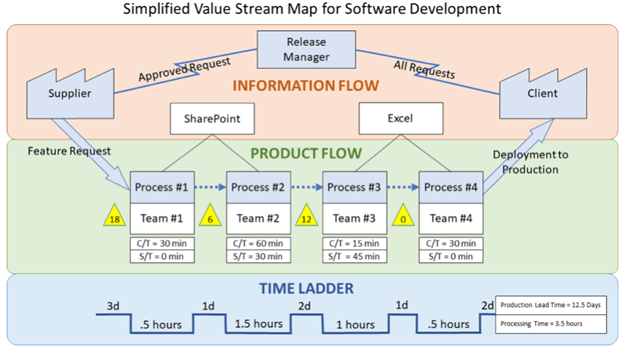
Step 2: Define your current state
The current state is essentially a map of how you do things right now. Use the data from your scope identification process to create a value stream map of how your organization works.
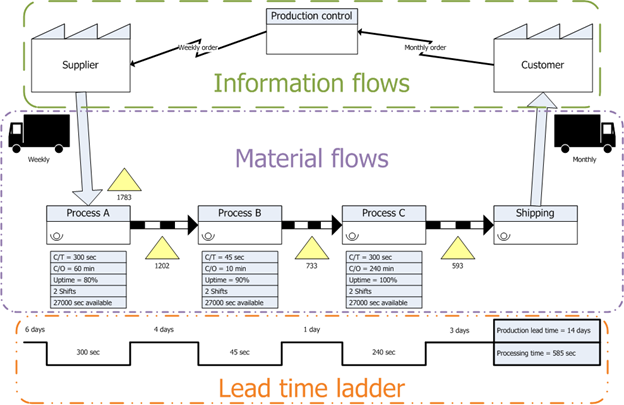
Start with an icon that represents the customer. Customer icons are ideally placed on the right-hand side of a value stream map. Consider adding the takt time next to each customer box on each value stream map.
Next, map all the processes that help you fulfill a customer’s demand. Start adding process boxes from the left. The first box usually records inputs from a supplier of raw materials. So, if you manufacture shirts, then the raw material can be cloth, buttons, dye, etc. Inside each box, record the:
- Cycle time (C/T): The time it takes to complete one part.
- Change over time (C/O): The time it takes to change a product type.
- Uptime: The percentage of time machine(s) required for a process is/are up and running.
- Yield: The percentage of parts that pass quality control.
- The number of employees it takes to complete the process.
Now that we have the processes laid out, it’s time to connect them with each other. Solid arrows are used to showcase shipments moving from suppliers to your factory. While push-arrows (dotted line) show how the end product of each process flows to the next, an inventory triangle can record the number of items being moved here.
We also need to record the information flow happening between the processes. Add a production control box to designate decision-makers who control production scheduling and control.
Now add the electronic and/or manual information lines both from the production control box and between the processes. It’s possible that certain processes require both kinds of information, so do consider interviewing the people involved.
Finally, add a timeline to your value map. Most opportunities for improvement will essentially help you shorten the duration of a process which is why it’s critically important to track the time it takes to complete each task. Some metrics you should track here are:
- Value-added time (VA/T): Time it takes to complete a process.
- Non-value-added time (NVA/T): Any time not spent directly on creating value for the customer, such as loading, unloading, transportation, waiting, etc.
- Cycle time (CT): The sum of all value-added and non-value-added time.
- Inventory time: The time inventory sits on a shelf.
- Lead time: The sum of all cycles and inventory time.
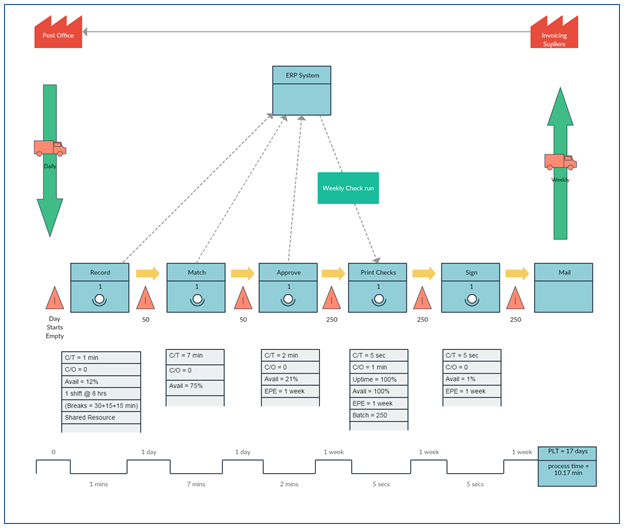
Step 3: Create your future state map
A value stream map is only beneficial when it can help you improve your processes. A future state value stream map builds on the current state by identifying opportunities for improvement, including:
- Reduced cycle time
- Quality improvement
- Faster delivery
- Lesser waste
Any opportunity in a future state map is highlighted using the Kaizen burst diagram. The first step to creating a future state map is to find out if your cycle times are keeping up with the takt time or not. Your overall production cycle time should at least be the same as your takt time.
However, even if your cycle times are equal to your takt time, there may be hidden opportunities for improvement, so it makes sense to analyze them. One way to do so is to look at each production unit’s non-value-added time.
Is inventory spending more time in waiting than processing? Are certain shared resources being underutilized? By keeping your production lead time under takt time, you will have more wiggle room to accommodate demand fluctuations, should they occur.

Why SweetProcess is Ideal for Value Stream Mapping
Part of the reason why VSM is so hard is that we tend to look at it as a one-time thing. Consequently, it begins to seem like a massive undertaking. But it doesn’t need to be that way if you make value stream mapping a regular routine in your organization. If all your business know-how is collected, organized, and easily accessible, then any VSM initiative will become exponentially easier. SweetProcess can help you out in a few key ways.
Document Your Policies, Procedures, and Processes
It’s all too common a scenario. A team’s up against the clock. Someone can’t seem to find a regulatory document needed to get the job done. He/She then goes on a file hunt in their hard drive, email, and Dropbox. Things only get harder when we throw versioning into the mix.
In most cases, a company’s policies, procedures, and processes are disparate groups of documents, know-how and tribal knowledge. As an organization grows, so do its ways of working as each member adds their own unique take on a problem. Tracking and implementing everything quickly becomes an issue.
FACS, or the Forensics Analytics Consulting Service, was all too familiar with the problem of documenting SOPs. “In a previous world, we were using PDF files for documenting SOPs. I guess the fact that we were doing it was a good thing, but the challenge was it would just sit on our server, buried in a folder somewhere. We would refer to it in emails, but frankly, I was confident that nobody was actually looking at it,” says Kevin Trapp, director of FACS. With SweetProcess, FACS managed to get all its SOPS in one place, which was easily accessible by the people who needed them.
Assign and Track Tasks
Documenting your company’s processes is merely half the battle. All the know-how is pointless if it’s not implemented properly. You also have to make sure each person understands the processes and procedures they have to implement. Doing so is easier said. Simply handing printouts or sending lists of to-dos don’t suffice today.
You should also be ready for any questions that your team members might have. And let’s not forget the occasional a-ha moments that people come up with that need to be recorded ASAP. SweetProcess was designed from the ground up to help companies create perpetual beta policies, processes, and procedures that can be assigned and modified to suit the task. Each procedure or process can be an instruction set in itself too.
The CEO of ShipCalm, Ted Fogliani, understood how such bottlenecks could throttle the productivity in his company. Being process-driven, Fogliani knew procedures and processes were meaningless without accompanying instructions which SweetProcess helps craft.
Bring New Employees Onboard Easily
Onboarding is usually a very tedious process, both for the company and the employee. While the company struggles to get its ways of doing things across, new employees often have a hard time catching up. SweetProcess makes it easy for both the organization and its new members to get acquainted with each other faster.
Since all your documentation is ready to use as-is, you only need to create an account for a new employee and teach them how to navigate through SweetProcess, which itself is very easy and user-friendly.
For example, internet service provider Everywhere Wireless was confronted with the challenge of hiring and training new employees faster than ever before due to increased operational demands. Even though they already had a good collection of SOPs, slow dissemination of knowledge was hindering their efforts.
As the company grew, it became evident that the old ways wouldn’t suffice and that they needed a faster way to get things done. After a thorough review of 70 process software, Everywhere Wireless settled on SweetProcess as their preferred solution.
With SweetProcess, you can:
- Document all policies, processes, and procedures in one place.
- Access these documents for employee onboarding, training, meetings, etc.
- Assign processes and procedures to the right people.
- Track how all of these things are being implemented.
- Communicate with key stakeholders about changes in a timely manner.
Not only can SweetProcess give you a bird’s eye view of your processes, but it can also present them in the form of a Swimlane diagram, allowing you to see at a glance which roles or departments are responsible for each step. You can easily change and/or upgrade these processes whenever needed, and once a policy or procedure is updated, the changes are reflected in real-time for everyone. This gives you the ability to change and evolve quickly as a business.
Are you interested in finding out more? Sign up with our free 14-day trial to see firsthand how easy process documentation and tracking really is with SweetProcess.
Conclusion
The best way to look at value stream mapping is to think of it as a systematic method of eliminating waste from a production process. One of the best examples of why there’s always room for improvement was during the 2020 lockdown when companies were forced to work remotely.
The advantages of remote work were being debated for a long time. As organizations had no choice but to allow their employees to work from home, its benefits became all too apparent. Companies needn’t spend as much on infrastructure and tools, while employees could save up on commute time, fuel costs, and work on their own machines.
Today, many companies are continuing to go with remote work as it helps them slash costs while enhancing productivity. Similar opportunities can be found by using VSM in your organization.
No VSM effort is complete without a proper future state mapping strategy.
Also, download our Future State Checklist to ensure your company remains on track.