Last Updated on April 18, 2025 by Owen McGab Enaohwo

Are your employees feeling lost and unsupported? It’s more common than you think. Especially since such issues are rarely reported, feeling lost and unsupported can seriously impact your company’s performance, especially when goals and expectations are unclear.
Recent studies paint a stark picture: only 38% of employees clearly understand their expectations. Moreover, just 37% of companies encourage regular goal updates. This lack of clarity and support has returned employee perceptions to pre-pandemic levels.
The pandemic has shifted employee expectations. They now seek more information about their work’s value and how it connects to company goals. However, companies are regressing in their performance management practices. Managers are overwhelmed and struggling, further affecting goal alignment and clarity.
Enter the swimlane diagram—a powerful tool that can untangle these process hurdles. Imagine a visual map where roles and responsibilities are clearly defined. Swimlane diagrams do just that.
They make it easy to see who is responsible for each task, turning chaos into clarity. This visual tool can significantly boost employee engagement and retention. Employees will likely stay and perform well when they understand what is expected of them.
Swimlane diagrams can streamline processes, clarify expectations, and support better performance management practices. In this guide, you’ll learn how to create and implement swimlane diagrams. Let’s begin.
Here’s What You’ll Learn In This Guide:
Benefits of Using Swimlane Diagram in Your Business Process
7 Steps to Create a Swimlane Diagram
Standard Parts of Swimlane Diagrams
How SweetProcess Helps You Get Started With Swimlane Diagrams
Best Practices and Tips for Creating an Effective Swimlane Diagram
Swimlane Diagram vs. Flowchart
Are Swimlanes Workflow Diagrams?
What Is a Swimlane Diagram?
A swimlane diagram, also known as a swimlane flowchart or cross-functional flowchart, is a type of diagram that visualizes a process from start to finish.
Its division distinguishes it into “lanes,” each representing a different actor, department, or system responsible for a part of the process.
These lanes run parallel to each other, typically horizontally or vertically, and contain the process steps or activities assigned to each responsible party.
The key swimlane diagram rules are:
- Lanes: Represent different actors, departments, or systems
- Process Steps: Specific actions or tasks placed within the lanes
- Flow Arrows: Indicate the sequence and direction of the process flow
- Decision Points: Indicate where choices must be made, often represented by diamonds
- Start and End Points: Clearly mark the beginning and the conclusion of the process
History of Swimlane Diagrams
In the 1940s, multi-column process charts, an early version of flowcharts, became the go-to for spelling out processes involving multiple departments. These charts laid the groundwork for today’s swimlane diagrams.
Swimlane diagrams didn’t gain much attention until Geary Rummler and Alan Brache published Improving Performance: How to Manage the White Space on the Organizational Chart in 1990. That’s why some people call them Rummler-Brache Diagrams, but we’ll stick with swimlanes.
In 1993, swimlane diagrams entered computer modeling, and Microsoft added them to Visio, a swimlane diagram software. As IT grew, so did the use of swimlane diagrams. Today, they are essential for business process mapping (BPM).
Get your 14-day free trial of SweetProcess now!
Benefits of Using Swimlane Diagram in Your Business Process
Swimlane diagrams offer numerous benefits for a company that wants to optimize its business processes. This enhances clarity, streamlines workflows, and improves communication across teams. By visually delineating roles and responsibilities, these diagrams make understanding complex processes and identifying inefficiencies easier.
Without swimlanes, businesses risk losing these advantages, leading to confusion, miscommunication, and operational delays. The lack of clear visual documentation can hinder training and onboarding, resulting in unprepared employees and increased costs. Ultimately, the absence of swimlane diagrams can undermine productivity and efficiency, costing businesses valuable time and resources.
Enhances Visual Understanding
A simple diagram elaborating on how a task is done is way more effective than a long, winding paragraph. By visually separating tasks by department or role, everyone can grasp their responsibilities at a glance. This is also why SweetProcess emphasizes task visualization using flow diagrams. For example, a sales process diagram can show how leads move from marketing to sales, ensuring everyone knows their part.
Improves Role Clarity by Clearly Demarcating Task Boundaries
Swimlane diagrams can work between departments and help workers understand who does what and when. This reduces confusion and errors. For instance, in a customer service process, swimlanes can clearly outline when a ticket moves from support to technical teams.
Simplifies Process Data Documentation and Training
Swimlane diagrams greatly simplify the documentation process by adding a visual layer to the text-heavy data employees often go through. By providing a clear, visual reference, these diagrams make capturing and conveying complex workflows easier. This visual representation helps standardize procedures, ensuring everyone follows the same steps and maintains consistency across the organization.
Improves Team Communication
By visually mapping out the workflow, swimlane diagrams help teams understand the interdependencies between different tasks. This understanding fosters better coordination and collaboration.
For example, in a product development cycle, a swimlane diagram can illustrate the flow from initial design to testing and final release. It clearly shows the handoff points between teams, such as when the design team hands off a prototype to the engineering team, and then the engineering team passes the developed product to the testing team.
Enhances Employee Grasp on Processes
Swimlane diagrams drill processes into employees’ muscle memory by providing a clear, bite-sized snapshot of their workflows. With a glance at the diagram, employees can easily recall their roles and how their tasks fit into the broader process.
Having visual references available at any time reinforces understanding and supports quicker recall. Employees can refer to the diagram as needed, helping them remember key steps and responsibilities without sifting through lengthy documents. This constant visual reinforcement embeds the process details into their muscle memory, making it easier to follow procedures accurately and efficiently.
Makes It Easy to Identify Gaps and Bottlenecks in Processes
When you have a detailed swimlane diagram, spotting where delays or obstacles might occur becomes easier. You can quickly see if there are any stages where tasks pile up or if there are interruptions in the flow. For example, if multiple tasks are waiting for a single step to be completed, it indicates a bottleneck that could slow down the entire process.
Swimlane diagrams help you identify gaps in your business process management efforts where tasks may be missing or responsibilities are unclear. These gaps can cause confusion and delays, impacting overall efficiency. By highlighting these issues, swimlane diagrams enable you to take corrective actions, streamline operations, and improve the overall effectiveness of your processes.
Streamlines Your Onboarding and Training Processes
Swimlane diagrams are highly effective in streamlining onboarding and training processes. They provide a clear, visual representation of workflows, simplifying new employees’ training experience.
During onboarding, swimlane diagrams present complex workflows in an organized and digestible format. This visual clarity helps new employees grasp tasks and responsibilities more quickly than traditional text-heavy documents.
For training, swimlane diagrams offer a structured approach to learning. They break down processes into distinct lanes, each representing a different function or team. The visual format helps reinforce learning by providing a constant reference point, making it easier to remember and apply procedures.
Create workflows effortlessly with SweetProcess. Start your 14-day free trial today.
7 Steps to Create a Swimlane Diagram

The great thing about swimlane diagrams is that they’re easy to create, even if you have no prior experience. Unlike other methods that require extensive training or complex software, swimlanes offer a straightforward approach to visualizing processes. Their intuitive layout makes it simple for anyone to organize tasks and responsibilities clearly. Here are seven swimlane diagram rules to follow.
1) Organize the Necessary Information
Arguably, the most time-intensive part of any enterprise is putting all the data under one roof. A study even found that 47% of surveyed marketers found siloed data as one of their most daunting challenges. This is also why we at SweetProcess make it extremely easy to upload all process documentation into your account with a click.
Start by listing out all the major tasks that make up the process. Then, identify who is responsible for each task—this could be specific roles, teams, or departments. Understanding the sequence of steps is essential; map out the order in which tasks are performed and how they flow from one to the next. Pay attention to interactions between different parts of the process, noting any dependencies or handoffs.
2) Map Out Your Lanes
Create lanes for each role, team, or department involved in the process. Each lane represents a specific entity’s responsibilities, providing a clear division of tasks. Start by drawing horizontal or vertical lanes across your workspace. Assign each lane to a particular role, team, or department involved in the process.
Clearly label each lane at the beginning to avoid confusion and ensure everyone knows which tasks fall under which entity’s purview. This step helps in visualizing the workflow by delineating who is responsible for each task.
By organizing tasks into lanes, you make it easier to track progress, identify overlaps, and ensure accountability throughout the process. This structured approach provides clarity and enhances understanding, making the workflow more transparent and manageable.
3) Find Your Starting Point
Finding the starting point can often be tricky because processes may have multiple entry points or overlapping activities. Determining which task or event rightfully begins the process requires a clear understanding of the workflow and its triggers. But, generally speaking, an activity trigger is the logical starting point. Also, each lane or activity will have its starting point.
You can start with an initial task, trigger, or event that begins a workflow. This could be anything from a customer placing an order to initiating a project. Next, place the starting point in the appropriate lane—based on the role, team, or department responsible—ensure that it aligns with the person or team that initiates the process. For instance, if a customer order initiates the workflow, position it in the lane for the sales team.
4) Move Through the Process
Step by step, map out the process from the starting point to the end. Place each task in the corresponding lane, ensuring it aligns with the role, team, or department responsible. As you arrange the tasks, involve stakeholder opinions to ensure accuracy and completeness. Their insights can provide valuable input on the sequence and responsibilities.
Use kanban boards to visualize and understand the process flow. Kanban boards can help you see how tasks move through different stages and identify bottlenecks or inefficiencies. Incorporate this visual tool to complement your swimlane diagram and provide additional clarity.
Apply modern best practices to enhance the diagram’s effectiveness. Use arrows to show the flow of tasks and their connections, ensuring they are clear and straightforward. Adhere to best practices such as maintaining a logical sequence and accurately reflecting dependencies. This methodical approach builds a coherent and complete diagram, making it easier for teams to follow the process and identify areas for improvement.
5) Review Your Diagram
After mapping out the entire process, thoroughly reviewing your diagram for accuracy and completeness is crucial. Pay special attention to details that are easy to miss, such as missing steps, unclear transitions, or incorrect lane assignments. These elements can significantly impact the clarity of the workflow.
One way to ensure your diagram’s completeness is to include as much stakeholder feedback as possible during this review. Stakeholders can provide valuable insights into any overlooked details or inaccuracies based on their firsthand experience. Their input helps ensure that every aspect of the process is accurately represented.
6) Use Swimlane Diagram Templates
Consider using pre-made swimlane diagram templates to streamline process management. These templates offer a structured format that helps bypass common errors and ensures completeness. Templates have built-in features that adhere to best practices, providing a solid foundation for your diagram.
They save time by eliminating the need to create a structure from scratch and ensure consistency across different diagrams. This is especially useful for beginners unfamiliar with swimlane diagram conventions or with standard processes that follow a predictable workflow.
Customize the template to fit your specific process by adjusting the lanes, tasks, and sequences. This approach simplifies the diagramming process and helps maintain accuracy and completeness. For example, SweetProcess provides a plethora of free flowchart templates for a large number of scenarios and work requirements on our blog. These can be used as starting points to create flowcharts or swimlane diagrams.
7) Select the Appropriate Swimlane Diagramming Tool
Modern diagramming tools make crafting detailed and accurate swimlane diagrams incredibly easy. Popular swimlane diagrams software like Microsoft Visio, Lucidchart, and Draw.io have intuitive features like drag-and-drop functionality, pre-designed templates, and easy editing capabilities.
- Microsoft Visio offers a robust set of diagramming tools with extensive customization options.
- Lucidchart provides a user-friendly interface with real-time collaboration features, making it ideal for team projects.
- Draw.io is a versatile, free tool that integrates well with various platforms, offering a range of diagramming options.
SweetProcess can also help you out here since the app greatly simplifies business process analysis with straightforward templates and workflow management, allowing you to map out processes. This flexibility makes it easier to create a clear, organized representation of your processes and use swimlane diagrams efficiently.
Standard Parts of Swimlane Diagrams
When creating a swimlane diagram, understanding its core characteristics can provide a valuable foundation. The elements such as labels, start and end points, decision points, and more are essential for organizing and visualizing processes effectively.
However, it’s important to remember that these characteristics serve as general guidance. Your specific requirements and the nature of your process will ultimately determine which elements are necessary and how they should be presented.
Labels
Labels clearly identify each lane, task, and role within the diagram. They provide context by naming departments, teams, or individual responsibilities. For example, in a swimlane diagram for an order fulfillment process, you might label lanes as “Sales,” “Warehouse,” and “Shipping.” Accurate and descriptive labels ensure that anyone reviewing the diagram can easily understand who is responsible for each part of the process and how tasks are distributed.
Start and End Points
Start and end points mark the beginning and conclusion of the process. The start point, such as a customer order, indicates where the process begins. The end point shows where the process concludes, like order delivery. Clearly defining these points helps set the scope of the process and provides a framework for mapping out all intermediate steps and tasks.
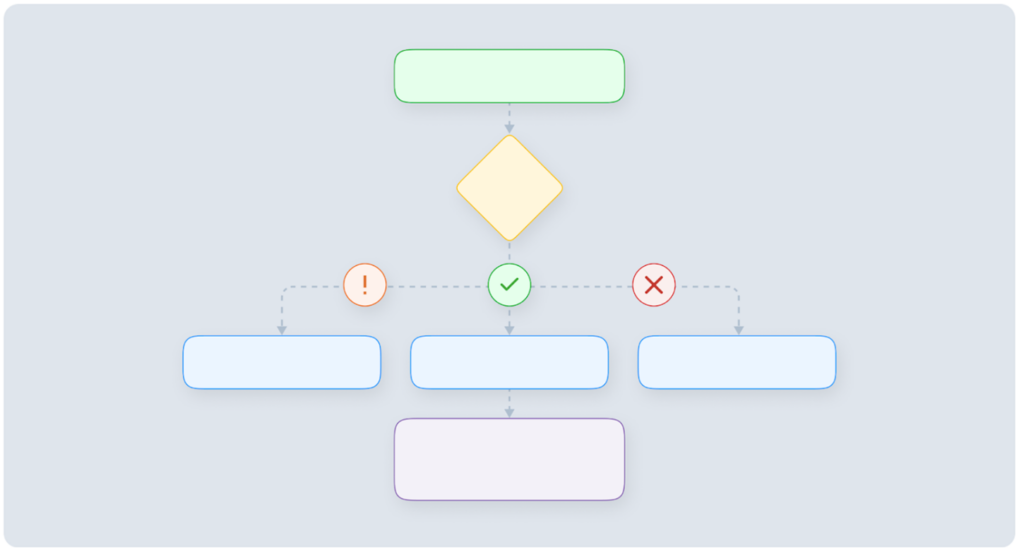
Decision Point
A decision point represents a juncture where the process can branch based on different conditions or choices. It is often depicted as a diamond shape. For example, in a hiring process diagram, a decision point might ask whether a candidate passes the interview, leading to different paths for “Hire” or “Reject.” Decision points are crucial for showing how various outcomes affect the workflow.
Action or Task
Actions or tasks are individual steps or activities that must be completed within the process. Each task is placed in the appropriate lane and shows what needs to be done. For instance, in a project management swimlane diagram, tasks might include “Draft Proposal,” “Review Proposal,” and “Approve Proposal.” Clearly defined tasks ensure that all necessary activities are included and understood.
Input or Output
Inputs and outputs represent the resources or results associated with each task. Inputs feed into a task, such as raw data or materials. Outputs are the results or deliverables produced by the task. For example, in a manufacturing process, an input might be “Raw Materials,” and an output could be “Finished Product.” Including these elements helps to clarify what each task requires and produces.
Connector
Connectors are lines or arrows that show the flow of the process and how tasks are linked. They illustrate the sequence in which tasks occur and how different parts of the process interact. For example, a connector might link “Receive Order” to “Process Payment,” indicating that one task follows the other. Connectors ensure that the process flow is clear and logical.
Document
Documents represent any written or digital materials used or produced during the process. They are often depicted as a sheet or a file icon. For instance, a document in a client onboarding diagram might be a “Client Contract” or “Onboarding Checklist.” Including documents helps illustrate the resources involved and the outputs generated at various stages.
Straight Arrow
A straight arrow indicates a direct flow from one task to the next. It shows a clear, linear progression in the process. For example, a straight arrow might connect “Submit Application” to “Review Application,” indicating that one step follows directly from the other without divergence. Straight arrows are used for straightforward, uninterrupted process flows.
Jagged Arrow
A jagged arrow represents a process flow with potential interruptions or deviations. It can indicate feedback loops or revisits to previous steps. For example, a jagged arrow might show a loop from “Review Proposal” back to “Draft Proposal” if changes are needed. Jagged arrows highlight areas where the process might require re-evaluation or correction.
Object on the Boundary Link
An object on the boundary link represents interactions or inputs/outputs that come from or go to outside the primary process boundaries. It is often depicted as an external icon or notation. For instance, in a customer service diagram, an object on the boundary might be “Customer Feedback,” showing that input comes from outside the internal workflow. This helps illustrate how external factors influence or interact with the process.
How SweetProcess Helps You Get Started With Swimlane Diagrams
SweetProcess can play a crucial role in getting you started with them. Firstly, SweetProcess helps you map out your processes in a detailed and structured manner. By breaking down complex tasks into smaller, manageable steps, SweetProcess allows you to see the entire workflow at a glance.
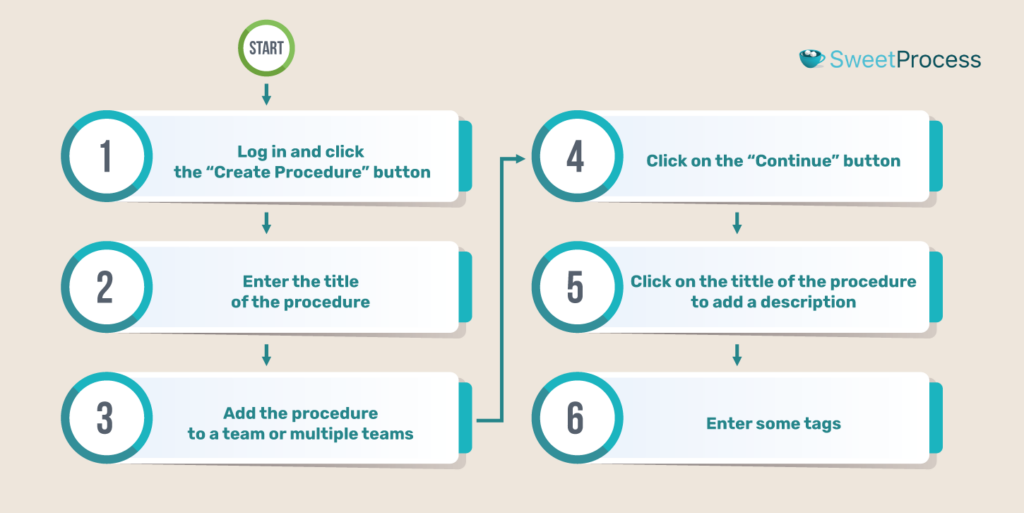
Creating procedures using SweetProcess
1) Log in and navigate to the “Procedures” tab in the top menu.

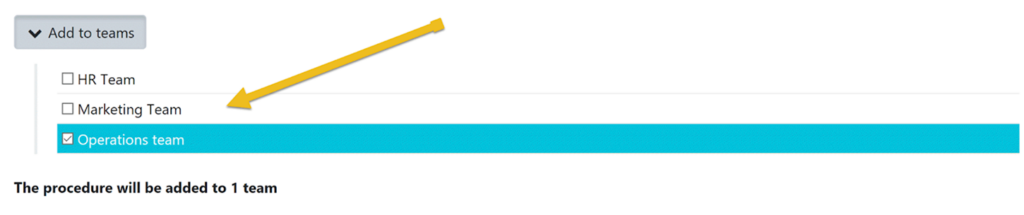
2) Give your procedure a title and description, and assign it to the requisite person or teams.
3) Use keywords to tag the procedure for easy identification.
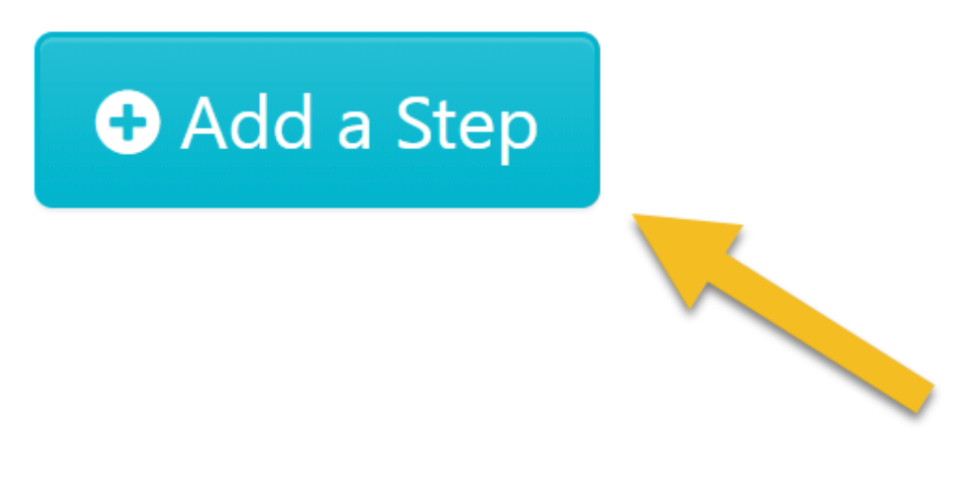
4) Click the “Step” button to add steps, including titles, descriptions, images, or links to your procedure.
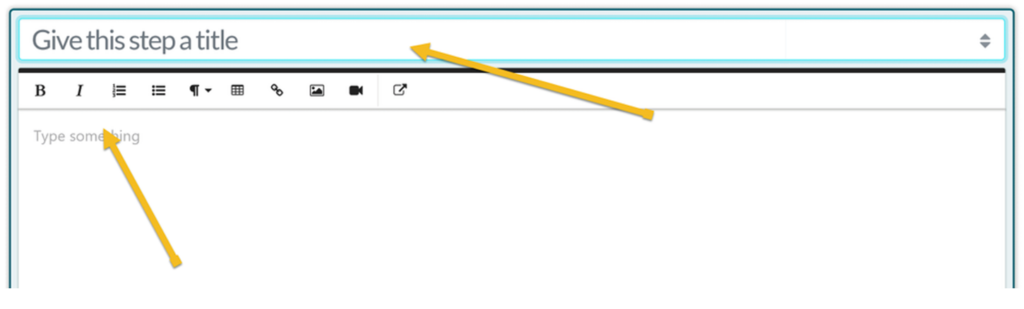
5) Define your step with a title and description.
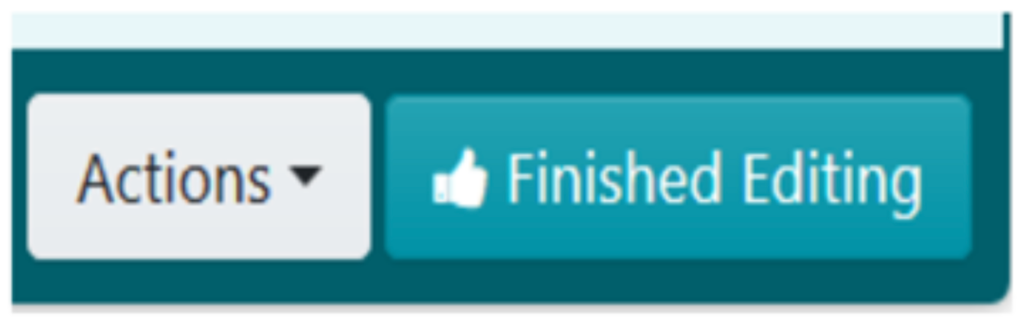
6) Once done, click “Finished Editing.” Repeat for each step.
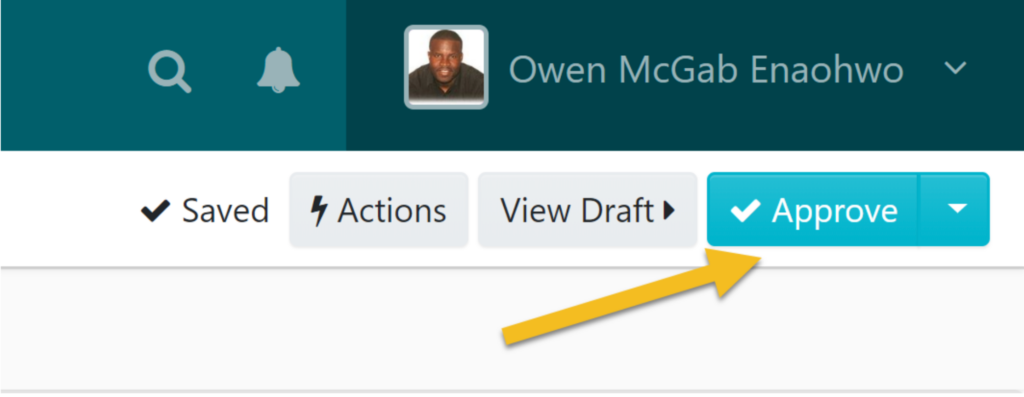
7) Click on “Approve” to authorize and publish the document.
8) You can also use SweetAI to generate procedure content automatically. Select Edit with SweetAI, and provide a title so our bot can write the procedure content for you. Edit as required.
The same process can be used to create processes, procedures, or policy documents. Once finished, you can access your document from the dashboard.
Get ready-made flowcharts with each document
Where SweetProcess really helps is the automatic flowchart creation. As you add an action step, you will see it being added to a flowchart on the right. All the process checklists you create with SweetProcess come with automatically created workflow diagrams. You can effectively create a comprehensive swimlane diagram by organizing and connecting these workflows.
Seamless collaboration with team members
Secondly, SweetProcess promotes collaboration and ensures everyone is on the same page. As swimlane diagrams often involve multiple departments or team members, having a centralized platform for process documentation is invaluable. SweetProcess enables team members to contribute their insights and updates in real time.
This collaborative approach ensures that your swimlane diagrams reflect the most current and accurate information, preventing any miscommunication or outdated processes from being included.
Additionally, SweetProcess provides an excellent repository for all your process documentation. When creating swimlane diagrams, having easy access to documented procedures is essential. SweetProcess organizes your SOPs and workflows in a searchable, easy-to-navigate database. This accessibility means you can quickly reference any necessary process details while constructing your swimlane diagrams, ensuring no step is overlooked and every role is accurately represented.
In conclusion, while SweetProcess may not directly create swimlane diagrams, its robust features significantly facilitate their creation and maintenance. By providing clear process documentation, promoting collaboration, offering a central repository, and utilizing workflow illustrations, SweetProcess sets the stage for successful swimlane diagram implementation. With SweetProcess, you can ensure your swimlane diagrams are accurate, up-to-date, and truly reflective of your business processes.
Swimlane Diagram Examples
Swimlane diagrams come in all forms and shapes, adapting to various industry processes. These diagrams clarify responsibilities and streamline workflows. Let’s explore a few examples to understand their versatility and application.
Employee Onboarding
Swimlane diagrams for employee onboarding map out every step from recruitment to the first day on the job. They highlight tasks for HR, IT, and department heads, ensuring a smooth onboarding process. For instance, HR handles paperwork, IT sets up equipment, and managers plan training sessions.
Client Onboarding
Client onboarding swimlane diagrams guide the process of welcoming new clients. They outline each step, from initial contact to full integration. Sales, customer support, and technical teams all have their lanes. For example, the sales team confirms details, customer support sets up accounts, and technical teams handle software customization.
Task Management
Task management swimlane diagrams help teams visualize who is responsible for each task and how they interact. These diagrams break down projects into manageable tasks assigned to different team members or departments. For instance, in a marketing campaign, content creation, graphic design, and social media posts each have distinct lanes.
Project Management
Project management swimlane diagrams track the progress of complex projects across multiple teams and stages. They define roles, timelines, and dependencies, ensuring nothing is overlooked. For example, in a product development project, the design, development, testing, and launch phases each have their lanes. Swimlane diagrams are versatile tools that can enhance clarity and efficiency in various processes.
Tired of looking for a workflow solution? Give SweetProcess a whirl with our full-feature, 14-day trial.
Best Practices and Tips for Creating an Effective Swimlane Diagram

Creating an effective swimlane diagram starts with understanding your unique circumstances, strengths, and weaknesses. Your processes, team dynamics, and specific challenges should guide your decisions. A well-crafted swimlane diagram can help you improve clarity and workflow efficiency. Here are some best practices and tips to guide you.
Define Your Process Scope
To define the process scope, identify the start and end points of the process. For instance, if you’re mapping an employee onboarding process, decide whether your diagram will cover only the initial hiring phase or extend to include post-hire training and integration. By narrowing down the scope, you ensure that your swimlane diagram remains clear and manageable.
Determine which roles or departments are involved in each lane. This allows you to create lanes for each relevant participant. For example, in an onboarding process, you might include lanes for HR, IT, the hiring manager, and the new employee.
Consider the key steps and decision points within the defined scope. Outline these elements before creating the diagram to ensure a logical and comprehensive flow. If the onboarding process includes background checks, equipment setup, and orientation sessions, make sure each step is accounted for in the appropriate lane.
Identify Roles and Responsibilities
Start by identifying every role that plays a part in the workflow. This includes both direct participants and those who have approval or oversight responsibilities. Once you have your list, assign each role to a specific lane in the swimlane diagram. This visual distinction helps avoid confusion and ensures everyone knows their tasks and interactions.
For instance, you might have separate lanes for developers, testers, and project managers in a software development project. Developers focus on coding and implementation, testers handle quality assurance, and project managers oversee progress and coordination.
Clearly defined lanes prevent overlaps and missed steps. For example, in a marketing campaign, you might have lanes for content creators, graphic designers, and social media managers. Content creators develop the material, designers create visuals, and social media managers handle the posting schedule.
Use Consistent Symbols and Colors
Consistency is key to making your swimlane diagram easy to understand. If you already have a style guide, it will be a good starting point for deciding which notations to use. Standard notation protocols such as BPN (business process notations) 2.0 can also be used here.
Additionally, document the color scheme you intend to use in your company style guide and train everyone to stick to it. One color is for tasks, another for decision points, and additional colors are for other elements like start/end points.
Ensure uniformity and accessibility by using the same symbols and colors throughout the diagram. Text labels within symbols provide extra clarity. Consistent, clear swimlane diagram examples make processes easily understandable and help your team stay aligned.
Map Processes in a Logical Sequence
Arrange the steps of your process in a logical, sequential order to ensure viewers can easily follow the flow without getting lost. Start by identifying the beginning and end points of your process. Then list all intermediate steps in the order they occur. For instance, in an approval process, begin with submission, move to review, and end with approval or rejection.
Ensure each step naturally leads to the next. This approach reduces confusion and highlights dependencies. If there are branches or parallel paths, clearly indicate these with arrows and decision points. For example, after a review step, the process may branch into approval, requiring one path, and rejection, requiring another. Regularly review and update the sequence to reflect any changes in the process.
Add Context and Notes
By context, we mean any information in the form of a comment that can clarify a step. Adding context ensures that anyone viewing the diagram can comprehend each step’s nuances and requirements.
For example, if a task requires specific conditions or approvals, annotate it with a note detailing these prerequisites. This can include necessary documentation, approval hierarchy, or special conditions that must be met before proceeding. Such notes help clarify why certain steps are necessary and what must be done to complete them.
Additionally, use notes to highlight exceptions or special cases. If a particular decision point involves multiple potential outcomes, provide context to explain these variations. This added detail can prevent misunderstandings and ensure everyone follows the correct procedures.
Contextual notes can also reference external documents or tools required for a specific task, further enriching the diagram’s usefulness. By including this supplementary information, you enhance the swimlane diagram’s effectiveness as a comprehensive guide to your process.
Involve Relevant Stakeholders
Engage all relevant stakeholders in the creation of the diagram. Their input ensures the diagram accurately reflects the process and highlights critical points. For example, involve team leaders and key employees who execute the tasks. Have you consulted all necessary stakeholders to ensure the diagram is accurate and comprehensive?
Keep It Simple
Simplicity enhances understanding. Avoid clutter by focusing on key steps and eliminating unnecessary details. For instance, break down complex processes into smaller, more manageable diagrams if needed. Is your diagram straightforward and easy to read, or could it be simplified further?
Seek Feedback
Regularly seek feedback from those who use the diagram. Their insights can help you refine and improve it. For example, ask team members if the diagram helps them understand their roles and responsibilities better. Have you gathered feedback to ensure your swimlane diagram is effective and user-friendly?
By following these best practices, you can create swimlane diagrams that are clear, effective, and valuable tools for process management.
Creating workflows is tough. Don’t get bogged down by tedious details. Let SweetProcess do all the heavy lifting. Sign up today.
Types of Swimlane Diagrams
A swimlane can be tailored to any requirement, but here are some common implementations. Understanding these types can help you choose the right approach for your needs. Here are some swimlane diagram examples to kick off your process.
Swimlane Activity Diagram
Swimlane activity diagrams break down the flow of activities within a process. Each lane represents a different role or department, showing their specific tasks and interactions. For instance, separate lanes for customer inquiries, support agent responses, and managerial escalations can clarify responsibilities in a customer service process.
Swimlane Process Map
Swimlane process maps provide a high-level overview of a process, showing how different roles contribute to the overall workflow. They are ideal for complex processes that involve multiple departments. For example, in a product development process, you might have design, manufacturing, quality control, and marketing lanes.
Cross-Functional Flowchart
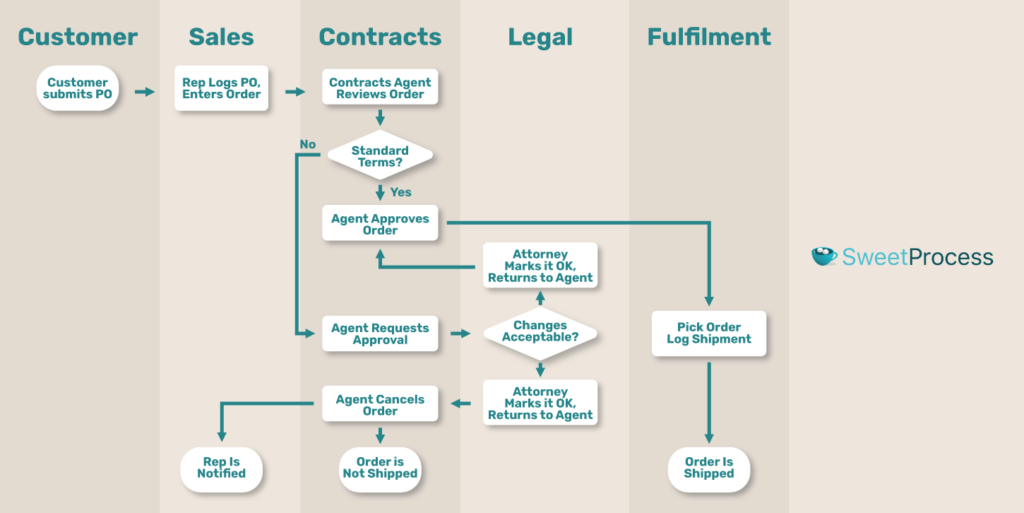
Cross-functional flowcharts illustrate how different functions or departments interact within a process. These diagrams emphasize the coordination and handoffs between different teams. For example, in an order fulfillment process, lanes for sales, warehouse, and shipping departments can highlight how an order moves from placement to delivery.
What Are Swimming Pools?
Swimming pools are broader categories that group multiple swimlanes together. Each pool represents a major participant or system in the process. For example, in a business process involving multiple companies, each company might be represented as a pool containing swimlanes for its internal departments.
Swimlane Diagram vs. Flowchart
A flowchart visualizes the sequence of steps in a process, using symbols like arrows, rectangles, and diamonds to represent tasks, decisions, and flow. It provides a straightforward way to understand the overall process.
The best way to look at a swimlane is a flowchart divided into lanes. You’ll see the same symbols and notations in a swimlane diagram with the added dimension of how different roles interact with one another.
Each lane represents a different role, department, or entity involved in the process. This structure clarifies responsibilities and interactions between different participants, which is either absent or lacking in flowcharts.
Are Swimlanes Workflow Diagrams?
Yes, swimlanes are a type of workflow diagram. They map out the flow of tasks and responsibilities within a process, making understanding how different roles interact and contribute easier. By clearly defining lanes for each role or department, swimlane diagrams provide a detailed view of the workflow, ensuring accountability and identifying potential inefficiencies. Do you need a detailed view of your workflow to improve coordination and efficiency?
Improve Your Company’s Swimlane Diagram Management Using SweetProcess
Swimlanes exist to help you make sense of your company processes. However, these diagrams are antiquated tools that have since been replaced with more modern cloud-based productivity solutions. While swimlanes are a great way to visualize how your organization works, tools like SweetProcess can help you better understand things.
As we mentioned above, SweetProcess can provide you with the building blocks for creating swimlanes. Also, unlike drag-and-drop editors, workflows with SweetProcess are created automatically every time you create a process document. The workflow diagrams are editable as simple flowcharts.
Ready to get started? SweetProcess makes your workflow creation easier. Sign up for our free 14-day trial.