Last Updated on April 18, 2025 by Owen McGab Enaohwo
Any organization on an upward trajectory grapples with the effects of rapid expansion. We are discussing new hires, clients, ballooning departments, and new systems, processes, and procedures.
This situation requires lots of organization and planningto ensure things move smoothly and everything works as it should. It also calls for an effective way for new and old employees to gain clarity on their roles while keeping track of new tasks and processes.
With the right organizational chart software, you can help your staff stay on their toes and understand how different roles fit together. Simply put, it helps them determine their duties and responsibilities, including who reports to whom.
If you are wondering where to start with organizing and planning your business systems, fret no more. Get SweetProcess, an invaluable tool that can help streamline all your company systems, processes, and policies.
What You’ll Learn in This Post:
11 Best Org Chart Software and Tools
Top Features to Look out for in an Organizational Chart Software
How to Choose the Right Organizational Chart Software for Your Company
What Is an Organizational Chart Software?
How to Know if Your Company Needs an Organizational Chart Software
Organize Your Company’s Procedures, Processes, and Policies in One Place Using SweetProcess
FAQs About Organizational Chart Software
11 Best Org Chart Software and Tools
A good organizational chart allows an organization to be more productive while keeping costs low. In this section, we will discuss several organizational chart software and tools, allowing you to choose the best fit for your business needs.
1. SweetProcess
SweetProcess is a process documentation tool and not an organizational chart software per se. However, since the system documents business processes, procedures, and policies, it can be an invaluable tool for companies searching for organizational chart software.
While most organizational chart tools do a pretty good job of capturing employee information and team reporting structure, many of them fail to address related policies, processes, and procedures.
These elements form the bedrock for an effective org chart. They lay the groundwork for your company structure and facilitate its implementation.
And that’s where SweetProcess comes in.
The SweetProcess charting tool delves deeper, provides more features, and outlines the exact processes and procedures new hires are expected to carry out. Additionally, you can incorporate images, graphics, and videos, making your document more engaging.
Once you record all your company processes, procedures, and policies and turn them into trackable checklists, managers can assign duties and track employee performance via a dashboard. Changelogs are stored in a central database, enabling those with editing access to make changes where necessary.
Ultimately, SweetProcess ensures smooth workflows and allows for on-the-job training.
Key Features
Below are some of the key features of SweetProcess. It helps:
- Create a company’s procedures, processes, and policies
- Turn a company’s procedures into trackable checklists
- Turn a company’s processes into trackable checklists
- Assign checklists as tasks for employees
- Track tasks assigned to employees
Let’s look at how some of these features work.
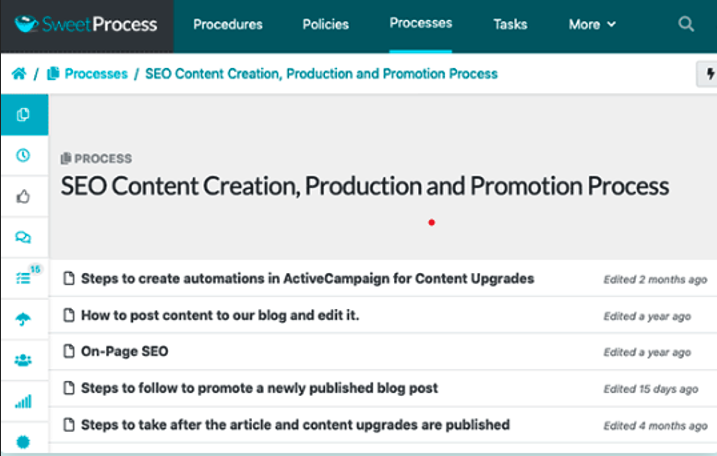
How to Create Your Company’s Procedures, Processes, and Policies in SweetProcess

Smooth workflows and output delivery will always remain a mirage if you don’t document business procedures, policies, and processes effectively.
Documenting repetitive tasks and storing them in a central location takes the guesswork out of task performance. Also, it acquaints employees with the firm’s goals, objectives, and core values while equipping them with the know-how to execute each task competently without supervision.
SweetProcess allows you to create procedures, processes, and policies tailored to your situation. It helps you formulate a list of instructions or guidelines for each team, as your chart outlines. Once issued, you can track and update the to-do lists whenever necessary directly from the application.
The best part is keeping your documents in one easily accessible spot. Moreover, you can link directly from procedures and processes to company policies.
How to Turn Your Company’s Procedures Into Trackable Checklists in SweetProcess
We have seen that SweetProcess can help you make it easier for employees to understand complex company procedures and processes. The key is to identify your pain points, have the team brainstorm the best approaches to resolve the challenges, and then write them down. Only with realistic operational structures can you achieve high-efficiency levels.
Let’s see how Benchwork Management turned its procedures into trackable checklists with SweetProcess.
The fast-growing financial advisory services firm had a capable team of financial experts but no standard operating procedures. It relied on a notebook, which contained most of the work processes. Unfortunately, the book wasn’t updated regularly, so new hires accessed outdated information.
With no universal working standard, there was no consistency. The staff operated independently, each performing tasks their own way. The results? Exploiting and maximizing the company’s growth opportunities became a challenge.
Sarah Beach, branch operations manager, and Elian Levatino, certified financial planner, joined hands to look for a solution. Their search for an application to carefully document their business processes led them to SweetProcess, which helped them streamline operations, allowing the entire team to work more efficiently.
Here’s what happened. The firm started by addressing the issue. As Sarah notes: “What are the pain points?…. We were able to address a lot of those issues by just getting it in writing.”
Next, the organization:
- Created and documented effective company procedures
- Streamlined the onboarding process using current information
- Developed a benchmark with room for employees to make amendments geared toward operational efficiency.
With SweetProcess, the team could even confirm whether documented processes were actionable.
How to Turn Your Company’s Processes Into Trackable Checklists in SweetProcess
Well-documented processes are crucial in streamlining an organization’s operations. The first step is to turn your processes into trackable checklists. But how do you even get started if the information you require is not easily accessible?
This was the headache facing Sarah Benner, Belvidere Community School’s newly appointed director of quality assurance. She needed to streamline the school’s operations to allow stakeholders the ability to access information.
The Belvidere Community School comprises six elementary schools, two middle schools, and three high schools—8,000 students and 400+ staff on its payroll.
Managing all these schools was a logistical nightmare. Sarah and her team drafted several procedures, but the documents existed in employees’ personal Google Docs. She required a user-friendly application that could effectively create, store, and distribute SOPs (standard operating procedures). Sarah evaluated several options, but according to her, “SweetProcess made the most sense to work with based on some of the functionality and the everyday work that we do.”
SweetProcess helps you bring together multiple procedures, forming a comprehensive workflow. For Sarah’s firm, the tool helped the organization address the following issues:
- Creating a centralized, easily searchable knowledge base
- Compliance with regulatory requirements
- Aligning admin procedures with board policy
- Streamlining stakeholder communication
How to Assign Checklists as Tasks for Employees in SweetProcess
A business might have some form of SOPs, but a lack of effectivedocumentation and the use of basic tools makes employees unable to execute their tasks successfully. Take Google Docs, for example. Documents could be stored in multiple locations, making it difficult for team members to access them.
Dr. Jeremy Weisz of Rise25 found himself grappling with this problem. His firm helps organizations reach their ideal prospects, referrals, or strategic partners through podcasts.
However, his employees constantly needed him to provide info or clarify certain issues since the company’s documents were disorganized. On learning about SweetProcess, his main concern was getting value for money. Fortunately, the system offered that and more. It was easy, straightforward, and also solved his woes.
Within a short term, operations improved immensely. The staff could locate the information they needed quickly and create processes following an easy, step-by-step process. Moreover, SweetProcess offers:
- Inbuilt document referencing
- Seamless client/employee onboarding
- Automated document approval
Jeremy advises that when streamlining company operations, it is best to begin with structuring folders for the relevant documentation. Once you have your procedures in place, you can tweak them regularly to ensure you consistently deliver high-quality services. He quips, “People refer…because we do a great job. We have great people and great systems. Retaining great people makes it easier for them to do the work they do, and it relates back to SOPs.”
How to Track Tasks Assigned to Employees in SweetProcess
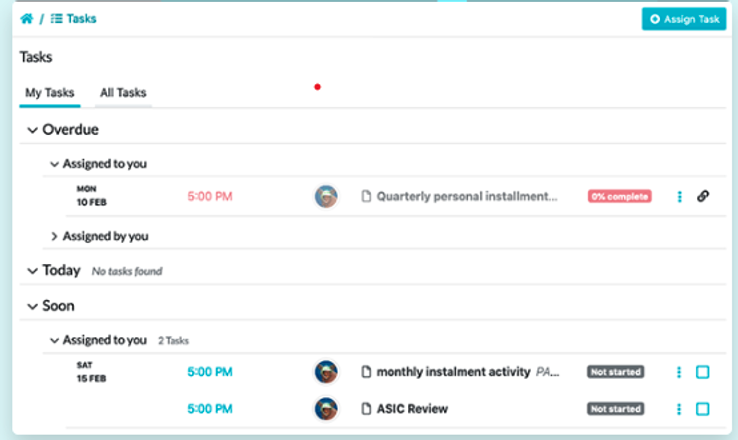
Companies with a large number of employees find tracking assigned tasks a colossal challenge. The thing is, many employees like to take shortcuts and, hence, might not follow guidelines.
So, how do you ensure your staff do what they are supposed to do all the time? By putting in place systems and procedures to ensure they are followed. And SweetProcess is the perfect tool for this.
Pricing

Starts from $99/month for the first 20 members plus $5/month for each additional user.
Free version: 14 days
Curious about how SweetProcess can turn around your business? Click here to sign up for a free 14-day trial that will help you document your company’s procedures, processes, and policies.
2. Organimi
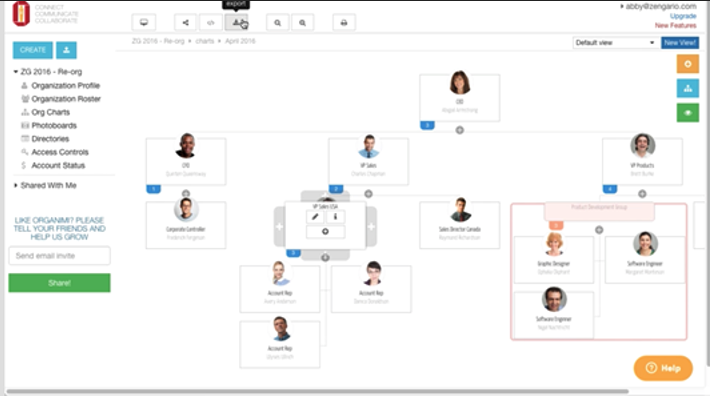
Organimi is a feature-rich, time-saving organizational planning solution designed for busy sales professionals, consultants, HR teams, and managers. It is straightforward, and you only need to focus on the tools you need to create your company’s organizational chart.
Core Features
- Easy to use: Its drag-and-drop feature allows you to build your chart quickly and easily. You can import employee data from your HR system, Excel, Salesforce, or CSV files, leaving the software to use the data to automatically create the organizational chart.
- Artistically designed: The tool provides unique layouts, photo boards, and public smart charts with multiple options in regard to color and shape.
- Easy customization: You can tailor the data in each position to include relevant parameters. Meanwhile, the directory and photo board make onboarding a breeze—you can view the company’s team and workforce planning in a single snapshot.
Pros
- User-friendly
- Good technical support for customers
- Affordable
Cons
- Not easy to set up a group with a title similar to another
Pricing
Starting price: $10/month
Free version: Lasts 14 days
3. Pingboard
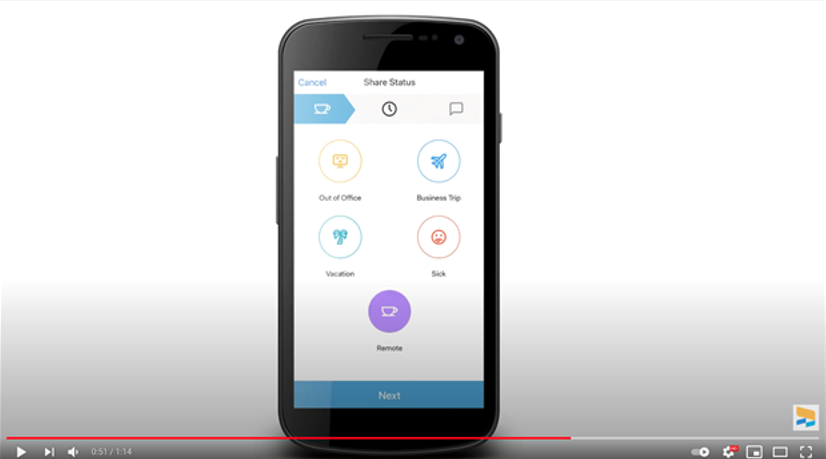
Pingboard takes creating an organizational chart to another level. The software boasts over 30,000 templates, giving you unlimited options. You can import data from Excel, your HR or IT system—employee directory and charting are automatic and embed the chart to your website.
Also, you can tailor-make your employee directory to include personal data such as birthdays and work anniversaries.
Core Features
- 360-degree view: A quick glance at the org chart lets you view everyone’s information. It’s easy to establish the reporting line and how departments fit together.
- Announce open opportunities: Let employees know about new roles, allowing them to progress or get a better fit.
- Automatic updates: Pingboard updates new information automatically. This includes new hires, name changes, and promotions.
Pros
- Shows status updates, i.e., sick, out of office, or vacation
- Employees can call, email, or send Slack messages directly from Pingboard
- User-friendly org chart editor
Cons
- Pricey compared to other tools
Pricing
Starts at $149/month/20 users
Free version: 14 days
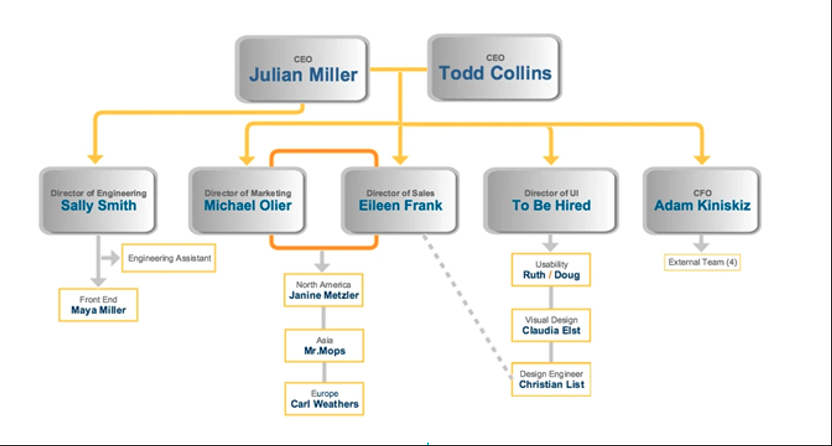
4. The Org Chart
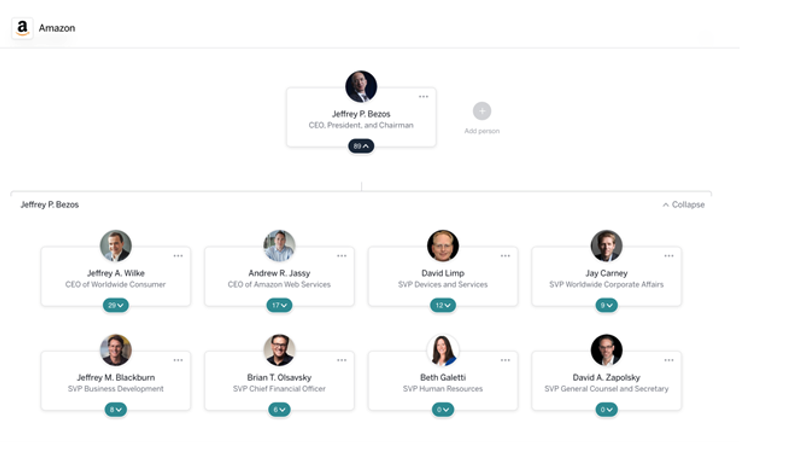
This free org chart application allows everyone to access the org structures created on the platform. Its features are not advanced, but you will get something simple. Besides, you can check out the competition or companies like Google for inspiration. Meanwhile, the staff can interact and share ideas with teams from other firms.
Core Features
- Free resources: Create org charts with in-depth and free resources.
- Talent acquisition: Show off your culture and attract strong candidates with a public org chart.
- Open: For inspiration, you can browse the charts of leading companies in your industry.
Pros
- Easy to set up, update, and implement
- Comprehensive charts
- User-friendly user interface
Cons
- Your org chart is open to the public
Pricing
Org Chart is free.
5. Lucidchart
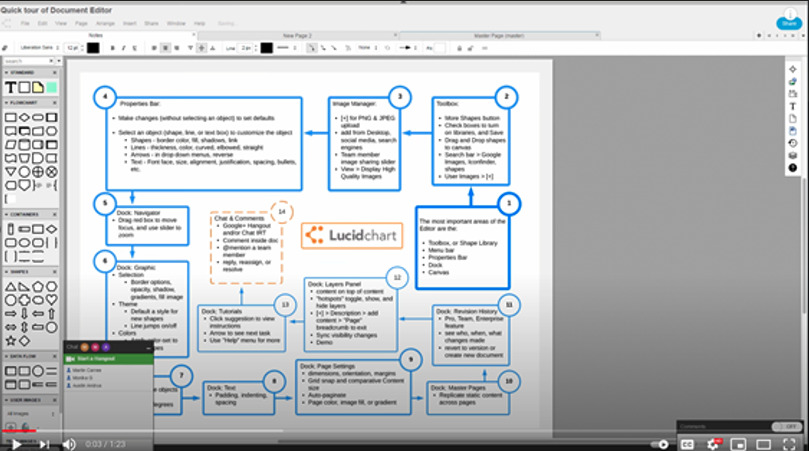
With Lucidchart, you not only create your organizational chart using auto visualization but also get access to advanced tools like mind maps, which are handy for brainstorming. The cloud-based application sports diagramming features, enabling you to chart your people and break down complex processes for the best communication and collaboration.
This popular app allows members to collaborate, and with everyone involved in the same space, it’s easy to make the right decisions.
Core Features
- Intuitive interface: The Lucidchart platform supports intelligent diagramming, allowing teams to visualize and comprehend complex ideas quickly.
- Collaborative tools: Choose from an array of tools such as in-editor chat, co-authoring, and collaborative cursors.
- Integration: The app easily integrates with other tools such as Google Workspace, Asana, Microsoft Office, and Slack
Pros
- Provides org chart templates
- Comprehensive flowcharting features
- Promotes alignment and decision-making
Cons
Pricing
Starts at $7.95/month
6. Creately
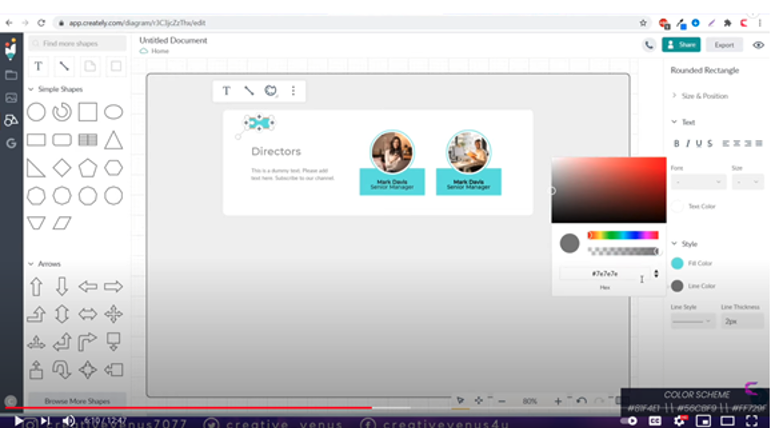
Creately is a visual collaboration workspace where teams can brainstorm, plan, and implement ideas. The diagramming application helps you create a robust org chart complete with collaboration features using a drag-and-drop feature.
You can either start from scratch or use the available templates to create your chart.
The app contains default shapes and titles, which you can edit, adding positions, descriptions, and photos as you see fit.
Core Features
- Intelligent data integration: Users can pull files from unrelated platforms.
- Stunning user interface: The workspace supports multiple formats, including spreadsheets, tables, and notes. You can also add links, tasks, and workflow status.
- Easy collaboration: Members can send email invitations for project collaborations or use the video-call button for discussions.
Pros
- Powerful whiteboard collaboration
- Easy to customize
- Web-based but can be used offline
Cons
- App can be sluggish especially when accessed by several users simultaneously
Pricing
Starts at $5/month/user
Free version available
7. OrgChartPlus
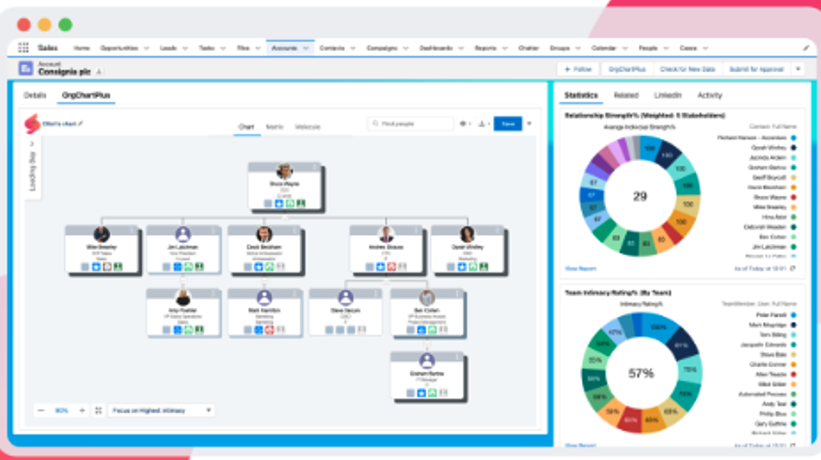
Built for Salesforce, this feature-rich application doubles as a relationship mapping tool. It helps you build your org charts by pulling data from Salesforce, but the reports are shareable beyond Salesforce users.
OrgChartPlus provides stakeholder templates you can customize based on titles and roles. The app then adds your contacts automatically. It’s an excellent tool for gathering real-time customer insights.
Core Features
- Quick setup: You can create from scratch using the easy-to-use, drag-and-drop interface or templates.
- Customizable: Tailor the chart to your organization’s unique needs.
- Reports: Delivers adaptable reports for efficient analysis, plus you can create dashboards for different teams/user levels.
Pros
- Supports multi-users
- Can export charts to PowerPoint or Word
- Three views allow for deeper visualization and organization
Cons
- Might suit sales organizations best
Pricing
Starts at $30/user/month
8. ChartHop
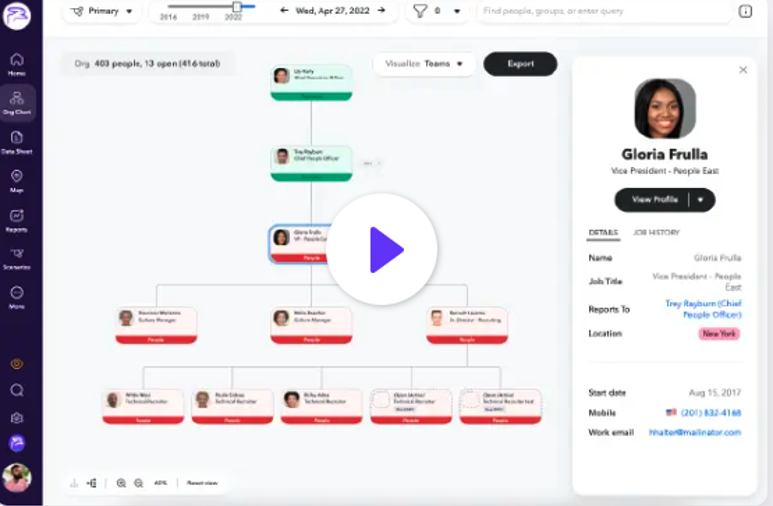
ChartHop offers a different take on charting an org chart. The software is designed to help companies communicate individual roles better while offering transparency. With ChartHop, updates are automatic; you can see new employees and those transitioning.
The interactive org chart is dynamic and data rich. There are maps and rich profiles with the tool offering options to include employee tenure and performance ratings. Overall, the intuitive platform allows you to manage chart changes seamlessly, saving the same for future referencing. You can also export older versions and audit a department or the entire org chart.
Core Features
- Filterable employee directory: Forge stronger employee connections where coworkers share skills, hobbies, location, and interests.
- Real-time visibility: Provides everyone with a real-time view of the company’s team structure.
- Syncing: You can sync the org chart with your HR system and show open roles.
Pros
- Promotes teamwork
- Employees can set trackable personal goals
- Paints a vivid picture of how the business evolves
Cons
- Some users might not find the application user-friendly
Pricing
Free for first 150 employees
9. Gliffy
Breathe life into your org chart with Gliffy’s user-friendly interface, robust themes, and templates. The interactive organizational chart maker makes it easy to drag and drop shapes, add colors, and share your creativity via a URL. There’s also the opportunity to collaborate in real-time via Confluence Cloud.
Gliffy is not a real organizational chart builder, yet it offers great flexibility to create org chart. Instead of organizational charting options, the software comes with customizable templates that you can tweak to create your processes and procedures.
Core Features
- Trackable: You can explore previous versions and make revisions where necessary.
- Integration: Easily integrates with Atlassian Marketplace tools.
- Powerful editor: Add photos and data, and edit shapes to suit your needs. Also, use your preferred fonts and style.
Pros
- Affordable
- Empowers teams to visualize ideas and processes
- Import and export data with ease
Cons
- Confluence add-ons mean extra costs.
Pricing
Starts at $9/month/user for a team of 9
Free version: 14 days
10. SmartDraw
SmartDraw has been around for a while and offers more than just organization charting capabilities. Start from scratch or craft your org chart using the available quick-start templates. The powerful tool allows you to import data with a few clicks while collaboration with others is pain free.
Using this tool can enhance the quality of communications, planning, and process development in your firm. For end-users, it provides a visual tool, encouraging adoption and implementation.
Core Features
- Extensive charting templates library: Choose from hundreds of templates and symbols. It’s also possible to enhance diagrams with shape data.
- Seamless integration: The tool integrates with Google G-Suite, MS Office, and Confluence. You can import data, add diagrams, and share files via Google Drive, email, Excel, or PowerPoint.
- Powerful automatic formatting: Get perfect layouts in record time and create complex documents and designs.
Pros
- Excellent collaboration capability
- Rich in features
- A refined tool
Cons
- Confusing sidebar navigation as there are multiple tools
Pricing
Starts at $9.95/month/user
Free version available
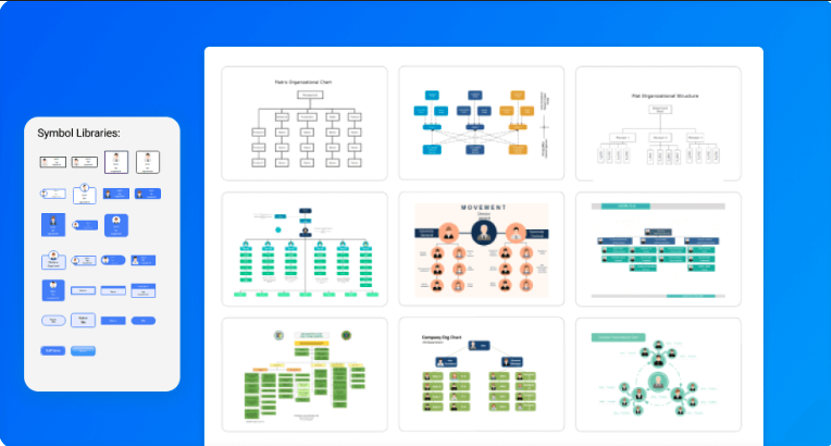
11. EdrawMax
EdrawMax is an organizational chart software that helps you visualize and build your org structure. It allows businesses to organize, connect, and update everyone in the company.
This tool is not only easy to navigate but also hassle-free. To start, simply sign up and begin using the software right away.
If you have been using Microsoft Visio, changing to EdrawMax is straightforward, as you only need to import the current .vsdx files. Once done, you can continue working seamlessly.
Core Features
- In-built templates: EdrawMax offers unlimited, customizable templates and layouts, enabling you to build an organizational chart with minimal effort.
- Effortless data importation: Different teams can work on a project, moving data from different locations. You can also export files from EdrawMax.
- Smooth connection: Connecting organizational charts with preferred symbols is a breeze. Choose your symbols, then drag and drop them into your chart.
Pros
- Easy to import and export data
- Cloud-based; thus you can work with anyone anywhere
- Supports file encryption and backup
Cons
- Mobile platform not available
Pricing
US $8.43/user/month
Free version available
Top Features to Look out for in an Organizational Chart Software

Organizational chart software is not a case of one size fits all. Some tools offer more features, while others may be costly but deliver more value for your money. While you should be guided by your company’s specific needs, below are features to look out for when evaluating the best org chart tool.
Multiple Layout Options

Good org chart software should help you portray your company’s organizational structure as is. By supporting multiple layouts like matrix, hierarchical, or circular, it can make your work easier, enabling you to display your chart by function, product, geography, or customer. Another plus is if it includes different page orientations.
Data Visualization

The ideal tool should come with a wide variety of design elements. These include different shape options, fonts, images, and color themes. This helps improve employee engagement and enhances adoption.
Data Import & Export

It should be easy to import or export files from various formats to the platform. The latter is important when users need to share, print, or modify documents. Moreover, when starting off, you need to import employee data from your HR data or Excel.
Customizable Fields

To configure a best-fit org chart, you need software that allows customization. This will allow you to change color themes, adjust text formatting, include branding, and add fields that best suit your company’s needs. Examples include shared roles, task descriptions, skills, promotions, contact info, and company announcements.
Drag-and-Drop Interface

The perfect tool should have a simple and interactive user interface. Too many details or advanced features only serve to bog down users. This feature makes it easier to use the software and update your chart with new changes.
Mobile Support

The modern workspace demands real-time connectivity. With mobile platform support, team members can access the dynamic org chart from any location. This is particularly useful for remote workers or those traveling as they can log on to the chart from wherever via their preferred device.
Collaboration Features

A good application should allow multiple users to work together. Features like sharing and commenting boost transparency and teamwork. Ultimately, the right technology should boost information flow, empowering teams to derive real-time insights, and apply data for effective forecasting and planning.
Security

The best software must be designed to safeguard the integrity of all company data. This entails using tiered permissions, multi-factor authentication, data encryption, and anti-malware security systems. Ensure the app supports secure communication between employees working remotely and that all sensitive employee information remains confidential.
A SweetProcess subscription helps companies document and organize their procedures, processes, and policies. Sign up today and get a 14-day free trial—no credit card required.
How to Choose the Right Organizational Chart Software for Your Company

When selecting the right org chart creation software for your business, consider the following aspects.
User Interface (UI)
Think simplicity. Go for an org chart solution that all employees, including new hires, can navigate easily and comfortably. Is it possible to collapse parts of the chart? Also, look out for features like filtering, zoom, and search, which help provide a richer user experience.
Ease of Use
Usability is critical. You want an application that is both simple to use and intuitive. It should be easy to do things like modify slides or cross-reference spreadsheets.
Integration With Other Tools
The best org chart solution is one that works seamlessly or syncs automatically with the business software you already use. Think Google Suite, HR data, email, or Slack. This ensures automatic updates, boosts accuracy, and keeps the org chart current while keeping employees informed about important updates.
Chart Customization
A flexible chart application can help you display your organizational structure in a more meaningful and practical way. You can customize the fonts and add visual elements, making your chart more relevant to the audience.
Organizational Chart Templates
An Organizational Chart Template simplifies the process of structuring your team’s hierarchy, allowing you to visualize roles and relationships effortlessly. Instead of creating an org chart from scratch, you can use pre-designed templates that streamline the process. With just one click, these templates help you build a professional and well-structured org chart, saving you valuable time.
Shapes and Icons Included
A simple hierarchical chart might not suffice if your desire is to show a crystal clear picture of your company. Different shapes and icons help you add more depth, making the image and content clearer and more relatable. Adding your company logo can also help make the org chart uniquely yours.
What Is an Organizational Chart Software?
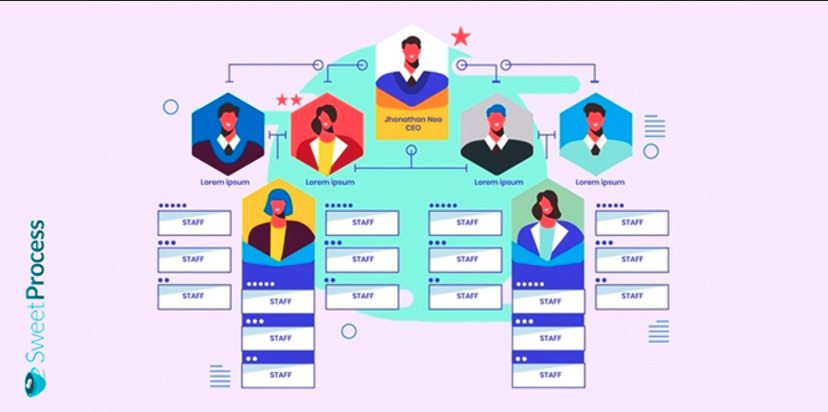
Organizational chart software is an application that allows you to create a visual representation of your company’s internal and management structure. The org chart gives employees a snapshot of the entire firm’s hierarchical/leadership structure and details how different roles fit together.
An org chart tool comprises features and elements that aid in the design of clear, dynamic, and collaborative charts and also updates them automatically as the company grows.
The application facilitates smoother business operations by enhancing communication, onboarding, planning, accountability, and decision-making.
How to Know if Your Company Needs an Organizational Chart Software

Here’s how to tell whether your business needs an organizational chart software.
Your company is growing fast
As a company expands, issues may crop up, i.e., with communication or in cases where hierarchy is not formalized. An org chart can help clarify company structure and enhance transparency and productivity by providing accurate info and organizing teams and departments according to their roles.
In the case of new clients or services, the chart can aid in planning for additional workforce.
You wish to simplify your onboarding process
A functional org chart simplifies onboarding by identifying gaps and redundancies. It also shows new hires how different departments relate and work together, clarifies their responsibilities, and who’s in charge of what.
You want all your structural and organizational data in one place
A good org chart stores company information in a single, easy-to-access database. Having everything in one place dramatically aids collaboration, resource allocation, and faster decision-making. It also helps you identify strengths and weaknesses in your structure.
You want to see a clearer picture of your organization
A functional org chart gives a wholesome view of your company. It helps define different roles, their inter-relationships, and limits, helping to show who is responsible for what so people can take ownership. It also eliminates confusion and makes team dynamics easier to understand. Employees can also view the steps needed for growth and promotion.
You want to demonstrate your organization’s culture
Used creatively, an org chart can also be a means to demonstrate your company culture. Most tools boast features that allow you to edit the chart to your specifics. Your chart can depict a casual outlook, a proud history, or how you like to do things.
You want to take collaboration to the next level
Sharing information helps employees work faster and with more confidence. The chart also helps users determine the right person to reach out to in case there’s an issue. Leverage cloud-based charting software for its many collaborative tools.
Your company works remotely
Remote work is the norm in today’s world. If your company falls in this bracket and most/all your staff work from different locations, you must ensure they’re all on the same page regarding company structure. It will also make onboarding new remote workers a breeze.
Organize Your Company’s Procedures, Processes, and Policies in One Place Using SweetProcess
A diagram that simply displays a hierarchical illustration of how responsibility flows in an organization is not enough in today’s dynamic business world. You need a tool that can create this, clearly show inter-layer relationships, and pull information from other resources within the organization to support collaboration and decision-making.
SweetProcess can help you achieve this and much more. The easy-to-use, cloud-based tool is invaluable in bringing to life an operational structure that can map out each layer of your organization and document the related processes as tasks. With progress tracking, and identifying areas of improvement made easier and convenient in-app, implementing your organizational structure becomes a no-brainer.
To sum up, SweetProcess helps you:
- Create your company’s procedures, processes, and policies.
- Turn your company’s procedures and processes into trackable checklists.
- Assign checklists as tasks for employees and track the same.
Those who have used SweetProcess testify to its unique ability to deliver on its promise. Take Don Houk, for example, president of Next7 IT, a company that supports businesses in enhancing their security and overall productivity.
Don found SweetProcess to be a user-friendly solution to process documentation. He needed to address operational setbacks caused by an ineffective workflow system—a Microsoft Word–based tool. These included a lack of accountability and indexing challenges.
Don desperately needed to upgrade his business operations to boost efficiency and serve his clients better. For his team to perform optimally, he needed to document the firm’s processes.
With SweetProcess, he managed to do this in addition to helping his team deliver superb services consistently. Furthermore, he could now:
- Onboard employees faster and with less hassle
- Boost self-learning by developing comprehensive procedures and processes
- Create checklists with subsets to help break down complex procedures
The business was transformed. According to Don, the firm evaluated several options, but “SweetProcess was the one that we ended up going to.”
For Tom, a quality assurance/sensory coordinator, the challenge was ensuring his workers strictly followed instructions. This entailed figuring out an effective way to retain quality assurance and maintain seamless operations at Stone & Wood. The current system was ineffective. It relied on Microsoft Word documents and binders.
The turnaround occurred with SweetProcess. The system helps you turn processes and procedures into implementable tasks. You can also track your teams on every step, ensuring each stage is checked and the entire task completed satisfactorily.
The tool boosted his team’s efficiency by providing hands-on information (it’s accessible on mobile devices), allowing them to carry out tasks with tremendous success. Managers can also tell whether an employee has logged into the system, checked out a procedure, and signed off.
Tom took advantage of the SweetProcess 14-day free trial feature to test the product. He recalls, “I did look at several different options online…. I liked SweetProcess from its ease of use and how flexible the sign-up was.”
Stone & Wood is a 150-employee, Australian-based brewing plant. It generates high-quality beer and takes great pride in its signature taste. It also strives to follow the industry’s stringent regulatory standards.
SweetProcess allowed the firm to:
- Streamline all organizational processes
- Update work processes and procedures
- Track whether employees followed laid-out procedures—with SweetProcess, you can track the latest activity on a particular task or check its history.
Are your processes and procedures all over the place? Take your cue from the above companies, and create an org chart that will guide your organization to the next level. Sign up for SweetProcess, your one-stop solution for streamlined business operations.
FAQs About Organizational Chart Software

Below are answers to commonly asked questions regarding organizational chart software.
Why use org chart software?
It allows you to structure and update your firm’s org chart, which in turn offers your staff a clearer understanding of roles, duties, and responsibilities. Additionally, it boosts communication and transparency, eases onboarding, and promotes faster decision-making.
Explore similar ways to assign responsibilities with the help of RACI charts
What is the best software to create org charts?
The best software to create org charts is one that best suits the needs of your organization. It should be flexible, intuitive, user-friendly, and allow integration with tools you currently use. SweetProcess ticks all these boxes.
Does Microsoft Office have an org chart tool?
Yes. Microsoft Office offers Visio, a visual, drag-and-drop tool that helps users build professional-looking org charts. It comes as an add-in for Office programs. Simply install and add it to your Word document, Excel worksheet, or PowerPoint presentation.
Does Google have an org chart tool?
Yes. Google provides an organizational chart builder that syncs instantly with your Google Workspace. You can create your free org chart easily with Google Sheets.